Loki is new system for aggregated logs that I keep hearing about. Some of it is marketing fluff, but I wanted to know—what IS Loki? Is it more of the same or does it solve some new problems? Let’s get a setup going, process some logs, and see if it’s worth its salt.
Quick Start
I’ll be describing how I got my setup running. This will be a local laptop install, grabbing logs from SystemD only. I’m going to take some shortcuts, just so that I can get a running system as quick as possible. If you’re installing onto a Kubernetes cluster: please use the official Helm charts!
Docker Compose
For this setup, I used a system running Fedora 34, with podman-compose, and docker-compose.yaml from the official Loki repository. I also changed the file. nstead of using grafana:latest (which, at the time of writing, points to Grafana 7), I used grafana:8.2.1, which has considerably improved log querying functionality.
$ pip install --user podman-compose
$ cd loki/production
$ podman-compose up -f docker-compose.yaml -d
Then we can open Grafana at http://localhost:3000/. On the left hand bar, select Configuration -> Data Sources, and then Add New Data Source, and then choose Loki. Type in the Loki URL, which is http://localhost:3100, and then select “Save and Test”. You should get a green checkmark to indicate that the Data Source was added successfully.
PromTail SystemD Logger
Now we have Loki running, but we need to actually log something. I installed the PromTail SystemD logger to collect some sample data from my local system.
I decided to install from a binary. I downloaded the most recent version of promtail-linux-amd64 for my system, and created a minimal configuration to get it to scrape the SystemD journal.
promtail-systemd.yaml
server:
  http_listen_port: 9080
  grpc_listen_port: 0

positions:
  filename: /tmp/positions.yaml

clients:
  - url: http://127.0.0.1:3100/loki/api/v1/push

scrape_configs:
  - job_name: journal
    journal:
      max_age: 12h
      labels:
        job: systemd-journal
    relabel_configs:
      - source_labels: ['__journal__systemd_unit']
        target_label: 'unit'
We can now run promtail manually to start getting logs.
$ promtail-linux-amd64 -config.file promtail-systemd.yamlThis is all a bit hacky, but with some luck we should now have enough of a setup that we can actually start learning the query language.
Usability
Label Matchers
The first thing we want to do with any log system — look at some logs! With Loki, we use label matchers to decide which logs to look at. We open up the Explore tab in Grafana and get hit with a blank query window:
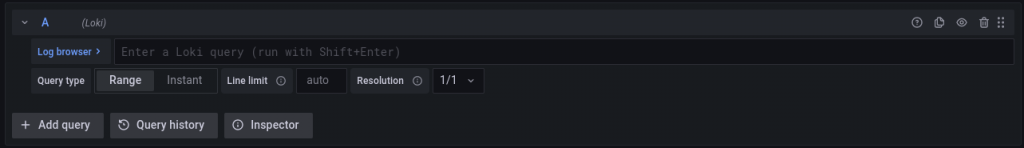
Not the greatest start. If we’re familiar with SystemD and Prometheus, then we can guess that we probably need to start typing something like {unit= , at which point the autocomplete feature finally kicks in, and we can get some logs:
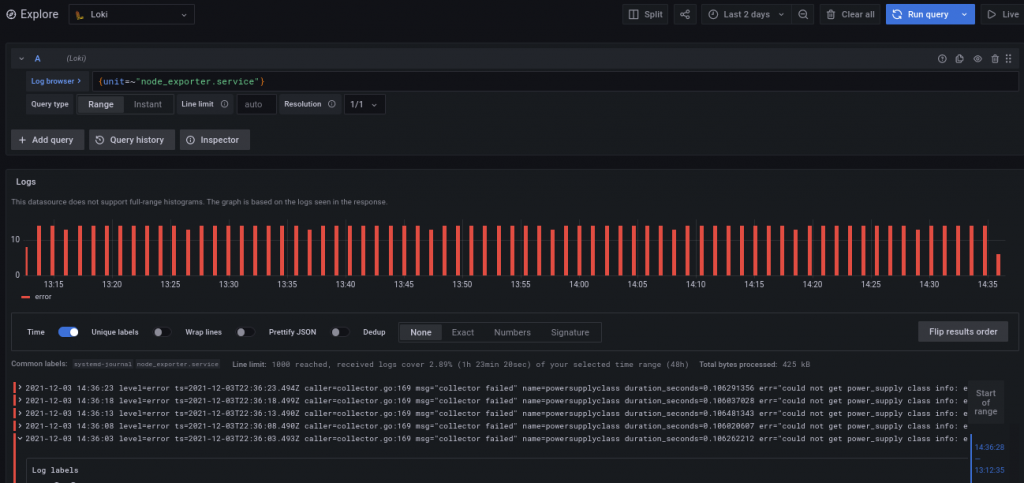
Label selectors behave very similar to Prometheus label selectors, so we can transfer our knowledge:
- Use
=and!=for exact matching.=~and!~for regex matching with re2. - Comma separated strings to select fewer items (logical AND).
- There are no metric names, so Prometheus
metric_name{label1="value1"}becomes just{label1="value1"}. - You can’t write patterns that match the empty labelset. This is a bit annoying for us since it prevents us from viewing all the logs. We can still get all the logs with a workaround like
{job=~".+"}(match all queries with ajobstring with one or more characters)
All in all, this gives us a decent amount of power for selecting logs. But given that this is a laptop with only one label, and that it’s so similar to Prometheus, I won’t explore this area any further, for now. Let’s analyze some logs!
Pipelines
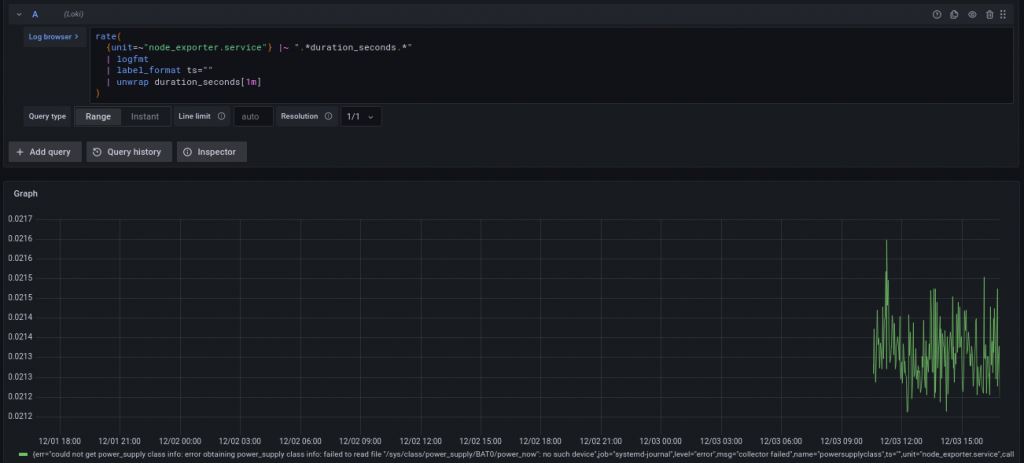
Our node_exporter query is in LogFmt, so let’s parse it to get structured data.
{unit=~"node_exporter.service"}
| logfmt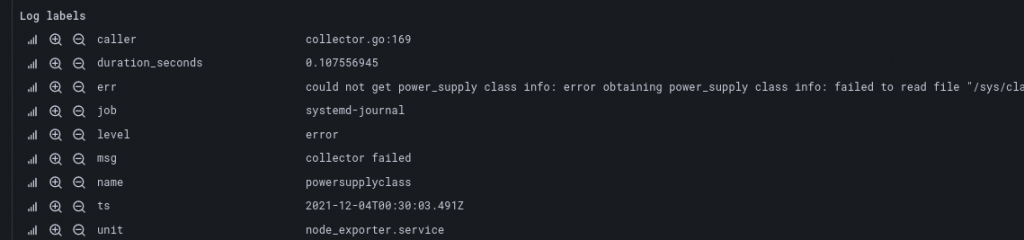
Now we have structured logs. We can process the log further, or convert it to a metric, using unwrap.
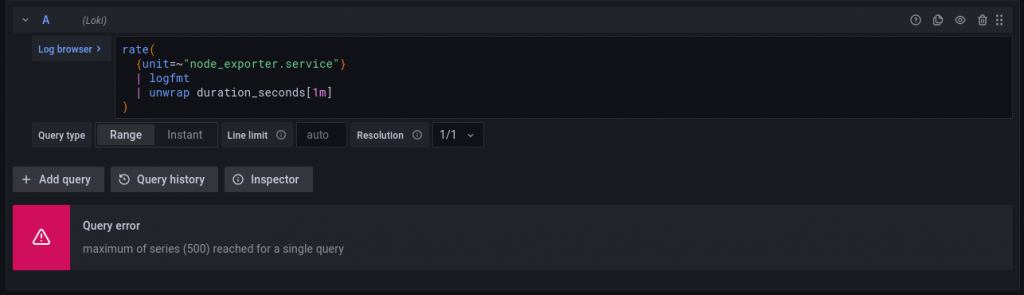
Oops, too many metrics! Since each metric has unique labels, now we’re creating a metric for each possible label, causing a combinatorial explosion. In our particular case, that’s caused by the ts (timestamp label), which is unique for each log message. We’ll need to drop it with label_format:
We also could have fixed the cardinality explosion with a sum() expression, but that would make it harder to use statistical methods like quantile_over_time(). By using label_format to drop inconsistent labels, we make the metrics part of the query much easier to write, and avoid deleting important labels.
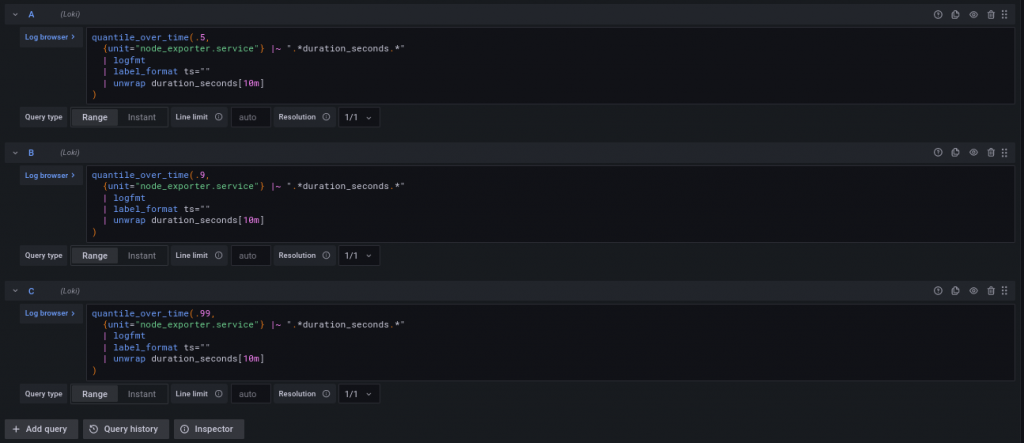
Now let’s ask an SRE question: Can Loki tell us the 50th, 90th, and 99th percentile durations for this query, over a 10 minute sliding window? It can!
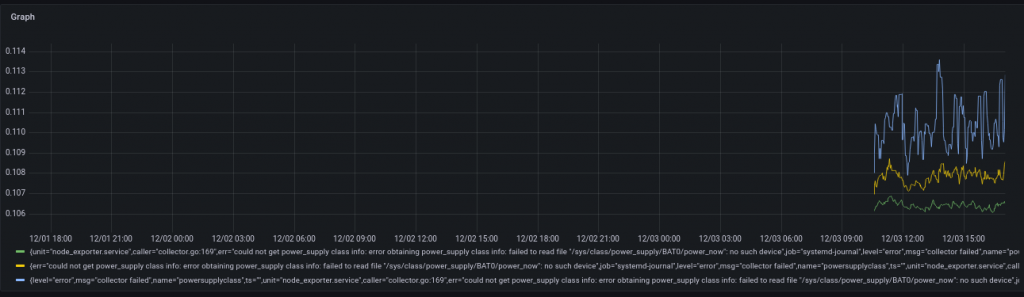
There were a few hiccups along the way, but the system seems to be quite capable of solving some fairly interesting problems without too much trouble, and without breaking out Python or Bash.
More importantly I didn’t have to do ANY log preprocessing. Most of the time when I’m debugging a real problem in a production pipeline, the logs are in whatever format a developer decided to use on a given day. This means that developers can continue to write logs in whatever form they find convenient, up to and including print("here"), and that SRE’s will be able to keep up no matter how they choose. That’s a big step forward and I think it’s hard to overstate.
Design Review
I also wanted to do a a skim over the official design documents, to understand what tradeoffs we’re making by using this sytem, over Elasticsearch. Will it handle well at scale? I won’t go too into depth here. If you’re interested, the official document is really good.
Storage
Loki uses two storage backends: the indexes, and the chunks. It can do local storage (useful for my laptop local test), but mainly it uses third party storage libraries for its data, such as S3 and DynamoDB, or their equivalents from other cloud providers.
As an Elasticsearch user, I know that maintaining a distributed database is a pain. It needs a ton of care, and the level of knowledge needed to properly maintain a cluster is seriously huge. By choosing to use 3rd party API’s to store data, this takes a huge load off our backs. If you’re an on-prem user, you can use an S3-compatible backend like S3. Lifecycle is managed by the storage provider, so I can use the configuration setups I’m already familiar with.
Indexing
This is barely a negative in my mind, but should be called out. Loki doesn’t create a full-text index or perform language analysis, preferring brute-force data search. I don’t use any of this stuff, but if you do, you might want to think twice before using Loki for it.
Configuring the label sets for Prometheus and Kubernetes seems tricky. I haven’t tried it yet, but there seems to be somewhat of a challenging tradeoff between having detailed labels, and keeping cardinality managable. In particular, I’m really curious if it will handle instance-level labels (ie Pod name as a label for Kubernetes). Prometheus can easily handle millions of unique label sets, I’ve yet to see if Loki will be up to the task.
Scale
I appreciate how Grafana labs have indicated that their priority is to minimize cost. No SRE wants to tell developers to “please log less”, but it’s a situation many of us have been in before. Loki promises to do a much better job storing large volumes of logs at a reasonable cost, and without excessive maintenance, which makes me very excited for it’s future!
Conclusions
The positives:
- Label matchers and pipelines work well together. You only pay to scan the data that you use.
- Pipelines are great. Builtin, chainable, LogFmt, JSON and Regex parsers are really powerful. We can pull information buried deep in the logs out into metrics queries, and then run an analysis like sliding quantiles, with a minimum of fuss.
- It’s fairly easy to get setup. It can be deployed as a monolith with local storage, or as microservices with a cloude storage backend. No more sharding or rebalancing!
- Promises extremely low cost for large log volumes. Don’t need to tell developers to shrink their logs.
And some of the negatives:
- Grafana’s histogram view and time picker are a bit confusing. If there’s more logs than can fit in a single query, then the time range will be truncated, which is a bit counter-intuitive.
- I’d really like a “match all” label selector, which would help for discoverability, and make it easier to run deep searches across the entire stack.
- It’s a minor gripe but I don’t love the branding of “Prometheus, but for logs”. It tries to copy some of the success of Prometheus and I think that sometimes this works well, and sometimes can be confusing, as it is quite a different beast. In particular naming the log scraping tool “promtail” seems like it was intended to create confusion. I think that Grafana Labs have done an amazing job with Loki, and they should market it independently of Prometheus.
Overall, I think Loki represents a fundamental shift in the way we do logging at scale. I can see this catching on in quite a big way, and I’m optimistic for its further development, and hope it sees success in the future!
Leave a Reply